Why Is Your Data Transfer Bill Growing?
The data transfer line on an Azure invoice rarely gets a meeting of its own. It sits under networking, grows a little each month, and nobody is quite sure who owns it.
In our reviews, it usually isn't customers downloading more. The line tends to grow from design decisions nobody priced: traffic crossing regions, peerings and network appliances, metered at each hop.
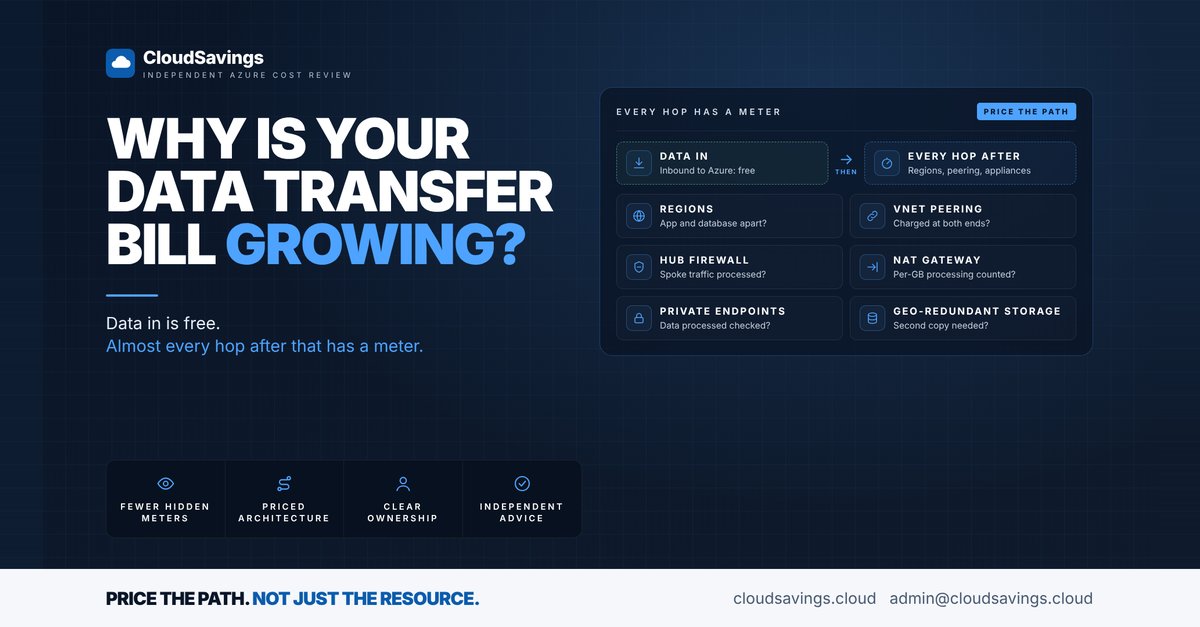
Inbound data transfer into Azure is free. Almost every hop after that has a meter of its own.
Why it happens
Most cost conversations happen at the resource level. A design review prices the virtual machines, the database tier and the hourly fee for the firewall. Those numbers are known before anything is deployed.
The per-GB meters are different. They depend on how much traffic flows, which way it goes and which components it passes through on the way. None of that is known until the workload is running, and by then nobody goes back to price it.
Hub-and-spoke designs make the effect larger. Take one gigabyte moving from one spoke to another through a firewall in the hub. It leaves spoke A over a peering, is processed by the firewall, then leaves the hub over a second peering into spoke B. Peering is charged on ingress and egress at both ends, and the firewall charges per GB processed. One transfer can touch several meters before it arrives.
Data transfer also creeps rather than spikes. A new integration, a chattier service or a backup job pointed at another region adds a few per cent. No single change looks big enough to trip an alert, so the line just grows.
What to check
These are the meters we look at first when the data transfer line has moved.
- Region placement. Do your application tier and its database sit in the same region? Transfer within a region doesn't attract bandwidth charges, but outbound transfer between regions does. Watch for replicas, log shipping and integrations that quietly cross a regional boundary.
- VNet peering. Does the team know peered traffic is charged at both ends, even when both networks are in the same region? Global peering is priced by zone, with the sending side's outbound rate and the receiving side's inbound rate.
- Hub firewall. Is spoke-to-spoke traffic forced through Azure Firewall? The firewall has a fixed hourly fee plus a data processing fee per GB, and the same structure applies in a secured virtual hub. Every GB routed through it pays both the processing and the peering meters.
- NAT gateway. Is outbound volume high enough that per-GB processing matters? NAT gateway bills resource hours plus data processed, which covers outbound traffic and its return traffic. Bandwidth charges apply on top, and the hourly charge starts when the resource is created, whether or not anything is attached.
- Private endpoints. Has anyone checked data processed, not just the hourly charge? Private endpoints bill per hour plus per GB in each direction. Writing to a storage account through a private endpoint is outbound data processed, reading from it is inbound, and normal data transfer pricing still applies.
- Geo-redundant storage. Does every GRS, RA-GRS, GZRS or RA-GZRS account need a copy in a second region? These accounts pay a geo-replication data transfer charge for the bandwidth used to replicate. The charge also applies when an account is switched from LRS to GRS, or from ZRS to GZRS.
- Cost analysis by meter. Has anyone grouped last month's spend by meter to see which transfer line actually moved?
How to check your own estate
All of these steps are read-only. Nothing here changes a workload or a setting.
1. Isolate the networking spend
In the Azure portal, open Cost Management and go to Cost analysis. Set the scope as high as you can, such as a management group or billing account, so every subscription is included. Choose the last six months and filter Service name to the networking services that appear in your data, such as Bandwidth, Virtual Network, Azure Firewall, NAT Gateway and Private Link.
You're looking for the shape of the trend, not a single number. Steady growth with no matching change in the business is the pattern that matters.
2. Group by meter
Set Group by to Meter. This is the same approach Microsoft's own guidance uses for unexpected charges, and it turns one networking total into separate lines for inter-region transfer, peering ingress and egress, firewall data processed and the rest. Compare month on month and note which meters grew fastest.
3. Trace the meter to a resource
For each meter that moved, switch the view to group by resource. Peering charges sit against virtual networks, data processed sits against the firewall, NAT gateway or private endpoint, and geo-replication sits against the storage account. If flow logs and traffic analytics are already enabled, they can show which source and destination pairs are carrying the volume.
4. Check where things actually run
Resource groups that span more than one region are worth a closer look. Azure Resource Graph can list them from the CLI:
az graph query -q "Resources
  | summarize regions = dcount(location) by resourceGroup
  | where regions > 1"
A multi-region resource group isn't wrong in itself. It's a prompt to ask whether the traffic between those resources needs to cross a region.
5. Review storage redundancy
List your storage accounts and their redundancy settings:
az storage account list \
  --query "[].{name:name, sku:sku.name, region:location}" -o table
Any SKU ending in GRS or GZRS replicates to a second region. Treat this as a resilience question first and a cost question second. Agree with the data owner whether the second copy is required before anyone considers changing it.
6. Name an owner for each meter
For each networking meter that matters, write down who owns the design decision behind it. The firewall usually belongs to the platform team. Cross-region replication usually belongs to the application or data owner. Without a name next to it, the meter keeps growing because nobody is accountable for it.
The lesson
Network spend is priced by path, not by resource. A design that looks sensible on a diagram can pass the same gigabyte through several meters before it reaches its destination.
This work sits squarely in the FinOps Understand Usage & Cost domain: get the data, allocate it, report on it, and know who owns each line. Start by grouping last month's spend by meter. The line that moved is usually the one nobody was watching.
Sources
- Azure bandwidth pricing
- Azure Virtual Network pricing
- Azure Firewall pricing
- Azure NAT Gateway pricing
- Azure Private Link pricing
- Azure Blob Storage pricing
- Identify anomalies and unexpected changes in cost
- Recommendations for optimising data costs
- FinOps Framework: Understand Usage & Cost
An independent view of your Azure spend. I sell no licences, managed services or remediation, so my findings have nothing attached to them.
Book a 30-minute call