Do You Need a Tool to Catch Azure Cost Spikes?
Usually not. Not first.
Azure's built-in anomaly alerts are a sensible start, and every subscription should have them turned on. But they have limits worth knowing before you rely on them alone.
The real gap usually isn't software. It's whether you can explain a spike from data you already have.
Why built-in alerts aren't the whole answer
Cost Management evaluates anomalies daily for each subscription. It compares the day's total usage with a forecast based on the last 60 days. A few details shape what that means in practice:
- Subscription scope only. Anomaly alert rules can only be created at subscription scope. A meter that doubles inside a large subscription can be lost in the total.
- About 36 hours after the UTC day closes. Detection runs after the day ends in UTC, so the data set is complete. In Sydney during daylight saving, the UTC day closes at 11am. A spike during Monday's UTC day is evaluated around 11pm Wednesday, local time.
- Email, once. The alert arrives by email, sent once at the time of detection. If it lands in a shared inbox, nobody is assigned to it.
- A 60-day training window. The model learns from 60 days of history, so a new subscription has little to compare against.
None of this makes the native alerts wrong. It means they tell you something moved, not what moved, who owns it or how much it matters.
Exports won't make cost data arrive sooner. What they give you is granularity, and control over what happens after a flag is raised.
What the routine checks
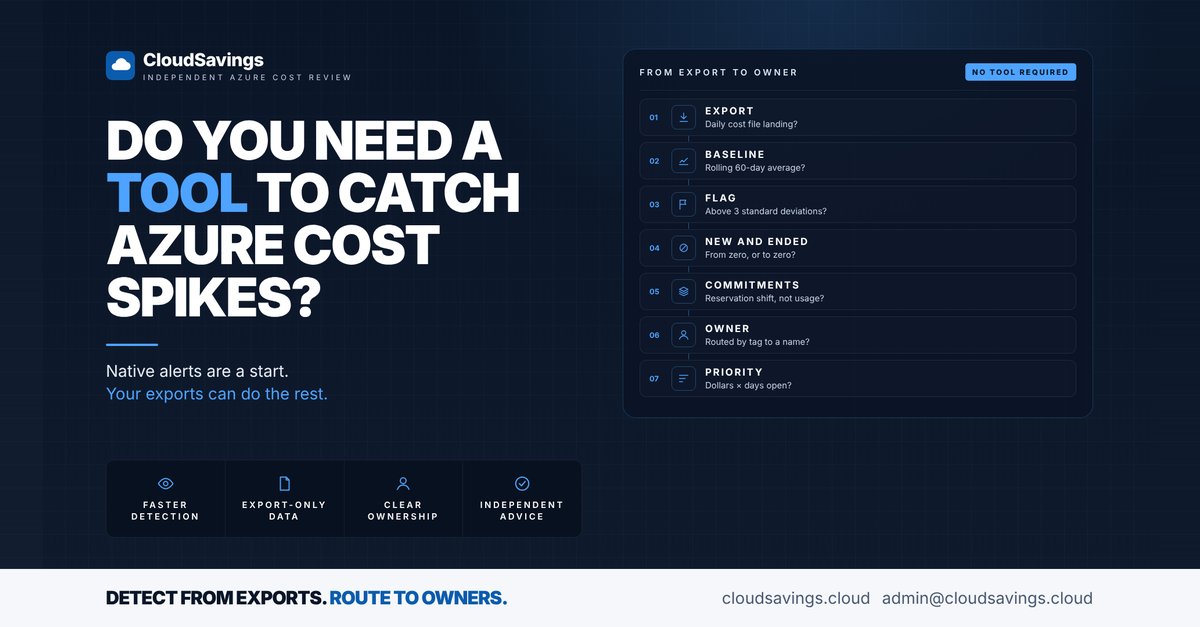
The routine we use in our reviews works from exports alone. Seven questions cover it.
- Export. Is a daily cost and usage export landing in a storage account?
- Baseline. Do you compare each day with a rolling 60-day average per subscription and meter?
- Flag. Do you mark days more than three standard deviations above that baseline, and week-on-week jumps that a single day hides?
- New and ended. Do you catch a meter appearing from zero, or dropping to zero?
- Commitments. Do you separate reservation or savings plan changes from real usage spikes?
- Owner. Can every flagged line be routed to a named owner through tags?
- Priority. Do you rank by dollars multiplied by days unresolved?
How to build it
Only the first step creates anything, and it's an export, not a change to any workload. Everything after that reads files.
1. Set up a daily export
In Cost Management, open Exports and create an export of Cost and usage details. Choose amortised or FOCUS for the main feed, which spreads reservation and savings plan purchases across their term. Set the frequency to the daily export of month-to-date costs, choose CSV or Parquet, and point it at a storage account you control.
Large exports are split into partitions, each with its own headers, plus a manifest.json describing the run. Read every partition, not just the first file. Because each daily run restates the whole month to date, rebuild the current month from the latest run rather than appending.
2. Build the baseline and flag
Aggregate to one row per day, subscription and meter, then compare each day with the 60 days before it. A short pandas sketch:
import pandas as pd

# df: all partitions from the latest run of each month
df["Date"] = pd.to_datetime(df["Date"])

daily = (
    df.pivot_table(index="Date",
                   columns=["SubscriptionId", "MeterId"],
                   values="CostInBillingCurrency",
                   aggfunc="sum")
      .asfreq("D")
      .fillna(0)
)

# Baseline: the previous 60 days, not including the day being tested
history = daily.shift(1).rolling(60, min_periods=30)
mean, std = history.mean(), history.std()

spike   = (daily > mean + 3 * std) & (daily - mean > 100)
new     = (daily > 0) & (mean == 0)
dropped = (daily == 0) & (daily.shift(1) > 0) & (mean > 0)

week = daily.rolling(7).sum()
jump = (week > 1.5 * week.shift(7)) & (week - week.shift(7) > 500)
The dollar floors of 100 and 500 AUD are illustrative. Without some floor, a meter that usually costs cents will flag every time it moves. Expect some noise from meters that only run on weekdays, and tune from there.
3. Treat new and dropped meters as their own signal
A meter appearing from zero is often a new service, a new SKU or a resize. Microsoft notes that some changes, such as resizing a virtual machine, surface as a new meter replacing an old one under the same resource. A meter dropping to zero can be a decommission, or a backup or pipeline that silently stopped. Both deserve a look even when the dollars are small.
4. Separate commitments from usage
Run the same comparison on actual cost and on amortised cost. In amortised data, a purchase is spread across its term. In actual data, it lands on the day it's bought. A jump that only appears in actual cost is usually a purchase, not usage.
Then check the PricingModel column. If quantity is flat but the same usage moves from Reservation or SavingsPlan to OnDemand, a commitment has likely expired or stopped covering that usage. That's a coverage problem, not a usage spike, and it goes to whoever manages commitments. The reservation details export helps confirm it.
5. Route each flag to an owner
The Tags column in cost details carries resource tags. Map an owner or cost centre tag to a person or team, and send each flagged line there rather than to a central inbox. Note that the Tags column excludes resource group tags, so tags inherited only at resource group level won't appear. Anything without an owner goes on a short list for the platform team to chase.
6. Cross-check with Advisor
Before raising a flag, check Azure Advisor's cost recommendations for the same resource. If a spike lines up with an existing recommendation, such as an underused resource, the owner gets a likely cause along with the alert.
7. Rank by dollars times days
Prioritise by excess daily cost multiplied by days unresolved. As an illustrative example, an extra 400 AUD a day left for ten days is 4,000 AUD of exposure. A one-off 2,000 AUD charge that's already explained is less urgent, even though it looked bigger on the day.
Measure the routine, not just the spend
Two measures from the FinOps Foundation keep the routine accountable: mean time to detect anomalies, and mean time to notify the owner. Track both over a quarter. If detection is fast but notification is slow, the problem is routing, not data.
From Crawl to Walk
The FinOps Anomaly Management capability describes Crawl as finding anomalies through manual report checks, with responses lagging a week or more. Walk adds context-relevant thresholds and alerts that reach responsible teams automatically.
The routine above is that step. It doesn't need new software. It needs an export, a baseline, a list of owners, and someone who runs it every day.
Sources
- Identify anomalies and unexpected changes in cost
- Tutorial: Create and manage exports
- Understand cost details fields
- FinOps Framework: Anomaly Management
An independent view of your Azure spend. I sell no licences, managed services or remediation, so my findings have nothing attached to them.
Book a 30-minute call